This section describes the formats of the various inputs read in by AlignMe:
It also describes the types of smoothing methods that can be used with scales for hydropathy (aka family-averaged) alignments.
FASTA
For fasta format, the first line of each file has to start with ‘>’ symbol followed by a header (which is usually the name of the sequence but can also be left blank). All other text in these files is taken to be the amino acid sequence. If more than one ‘>’ symbol is found, only the sequence following the first ‘>’ symbol will be used, and an appropriate warning will be given. Example of a file in fasta format:
>Header information and sequence identifier
ACDEFGIHALALASDFSFEURSTLASSDFSFEURSTLAS
QEERSLGITLSSDFSFEURSTLASSDFSFEURSTLASSQ
In a multiple-sequence alignment file, all sequences must have the same length, including gaps. This is because it is assumed that the sequences have been aligned.
Similarity matrices
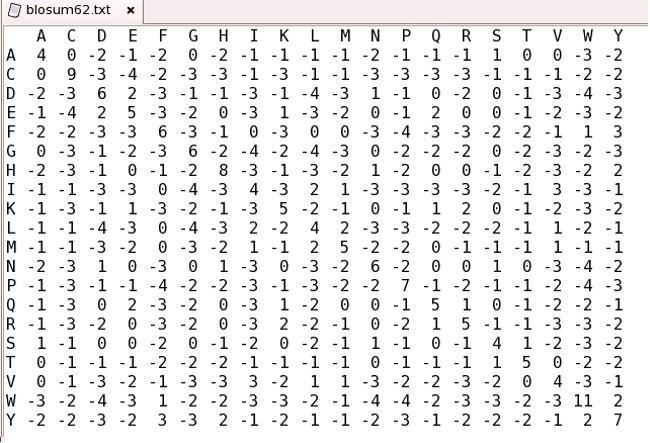
To align sequences in the traditional manner, i.e. with the SequenceSimilarity option, requires a similarity or substitution matrix that defines the likelihood of substituting one amino acid type with another. The following is an example of a matrix file in the correct format (i.e. BLOSUM62)
Position Specific Substitution Matrices
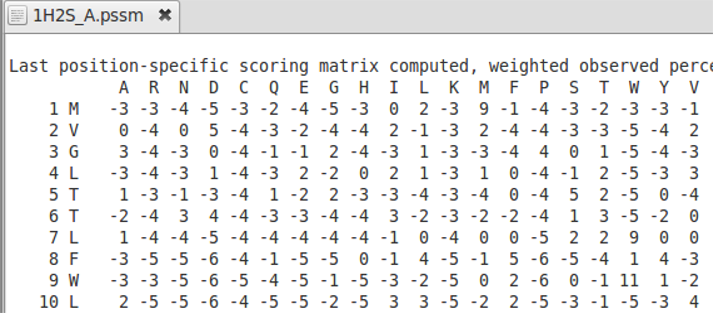
In contrast to general substitution matrices, Position Specific Substitution matrices have different substitution rates for each sequence position. The first column contains the number of the sequence position, the second column the amino acid at this positions and the following 20 columns are the rates of the amino acid from the second column to be replaced by one of the 20 standard amino acids (shown in line 2). Please note that AlignMe only supports PSSM that have a comment like „Last position-specific...” in the first line, followed by the 20 standard amino acids in the second line and all other amino acids in the next lines:
Scales
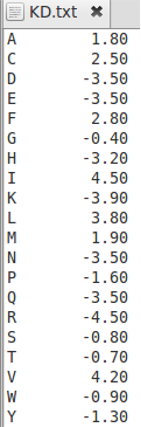
For aligning two sequences according to a scale such as a hydrophobicity scale, the ScaleSimilarity mode is used. This requires an input file in which each of the two amino-acid types is assigned a value on the scale. Thus, the similarity between two amino acids is the difference between their scale values. Note that, in order for the threshold gap penalty scheme to work, these scales have to be reversed in sign from their original values. That is, the original scales consider that hydrophobic amino acids have a negative free energy for insertion in the membrane. However, we wish to treat membrane regions as conserved, so we reverse the sign of the values. The following is an example input scale file (i.e. Kyte-Doolittle hydrophobicity scale), with reversed sign.
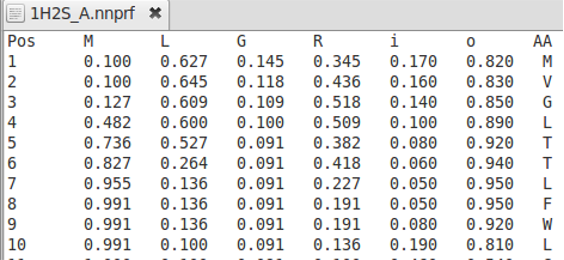
Profiles
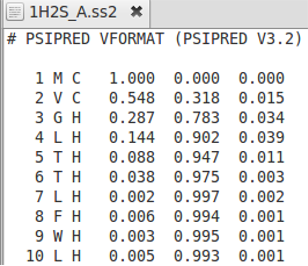
AlignMe allows for alignments of any kind of profiles like secondary structure predictions obtained from PSIPRED and from membrane predictions from OCTOPUS. The user has to choose the column from which the values should be taken, and it is possible to skip over commented lines using the “headerlines” option in the similarity score file see example.
Smoothing methods
Alignments with hydrophobicity scales allow the usage of sliding windows to generate a smoothed hydrophobicity plot that is not based on single amino acid positions only but also takes neighboring amino acids into account. The supported sliding window types are:
- For sequence-sequence alignments: None, triangular, rectangular, sinusoidal and zigzag.
- For msa-msa alignments: triangular_msa.
rectangular
In a rectangular window the (hydrophobicity) values of all amino acids within the window contribute equally to the total, which is then divided by the width of the window. This value is then assigned to the position at the window centre, so that the values of the neighboring residues are effectively used to smooth out the profile. This option may be used in combination with a 6 gap-penalty set to subdivide the sequence into two regions with different gap penalties according to a threshold value (see section on gap penalties).
triangular
The principle of a triangular window is similar to that of a rectangular window but emphasizes the value associated with the amino acid at the centre of the window, whereas the contribution of values either side decreases linearly from the central position. Thus, profiles become smoothed, but less drastically than in the case of the rectangular window. This option is may be useful in combination with a 6 gap-penalty set and a threshold value (see section on gap penalties).
sinusoidal
In sinusoidal averaging, the contribution of amino-acid positions either side of the central position will vary according to a sine wave. Thus, every 3.4th amino acid will contribute fully to the averaging, whereas every 1.7th amino acid contributes nothing to the averaging. Such sinusoidal window-averaging may be useful for aligning proteins consisting mainly of alpha helices because it mimics the periodicity of amino acid properties in a helix. Thus, for a position that is on a hydrophobic face of a helix, its score will be averaged along with other hydrophobic residues, but not with the hydrophilic residues in-between.
zigzag
A zigzag window tries to imitate the alternating hydrophobicity pattern of a beta-sheet (i.e. one side is hydrophobic and the other hydrophilic). Starting from the window-centre (i) every second amino acid contributes to the averaging of the central residue.
Example for a window size of 5:
Positions i-2, i, i-2 contribute to the average, whereas positions i-1 and i+1 have no effect on the average.
triangular_msa
To create average hydropathy profiles based on two MSAs, a triangular sliding window can be used. There are two main steps in this procedure:
- For every sequence in the MSA its own window-averaged hydropathy profile is calculated first. Due to the presence of gaps in the MSA, the sliding window in this case is flexible, i.e. its length can be extended by a number of gaps found on every side of the window, so that the window of a specified length N still covers N non-gappy positions.
- After average hydropathy profiles have been calculated for every sequence in the MSA, the average hydropathy profile of the entire MSA is calculated by averaging hydrophobicity values at every position in the MSA. At every position of the MSA hydrophobicity values are summed up, while gaps are ignored. Then the total sum at every position of the MSA is divided by the number of non-gaps.
Anchors
Each anchor has to be given as a line in the anchor file, following this scheme:
position_in_first_sequence position_in_second_sequence strength
e.g.:
25 36 1000
This would align residue 25 in the first sequence with residue 36 of the second sequence with a relative strength of 1000.